Skip links

SharedView

It’s not just about the likes and shares

Our social listening tool allows you to keep track of public mentions of your brand on Facebook, Twitter, Instagram, and Youtube—ensuring you sustain a strong online presence.

Our social listening tool allows you to keep track of public mentions of your brand on Facebook, Twitter, Instagram, and Youtube—ensuring you sustain a strong online presence.

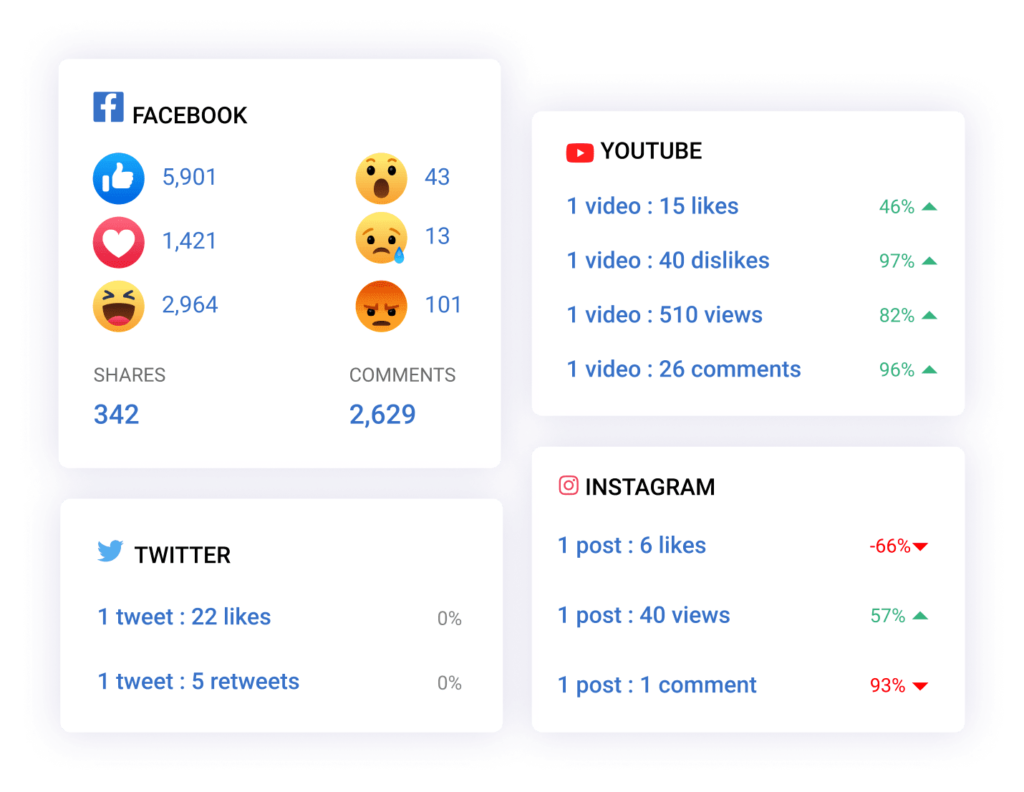
A social media monitoring dashboard showcasing engagement metrics across Facebook, YouTube, Twitter, and Instagram. The data highlights likes, shares, comments, and views, useful for tracking brand sentiment and online reputation management across multiple platforms.

Media Sources

Facebook

Twitter

Instagram

Youtube

Story Value

Easily identify, rank, and sort the stories that have the greatest potential to affect brand reputation positively or negatively.

Story Value takes into account the approximate audience size of stories, frequency, and position of brand mentions, relative authority of the writer of the story and of the publication or program, objective qualities of stories such as word count, clip length, the presence of bylines, and the presence of rich media within the stories.

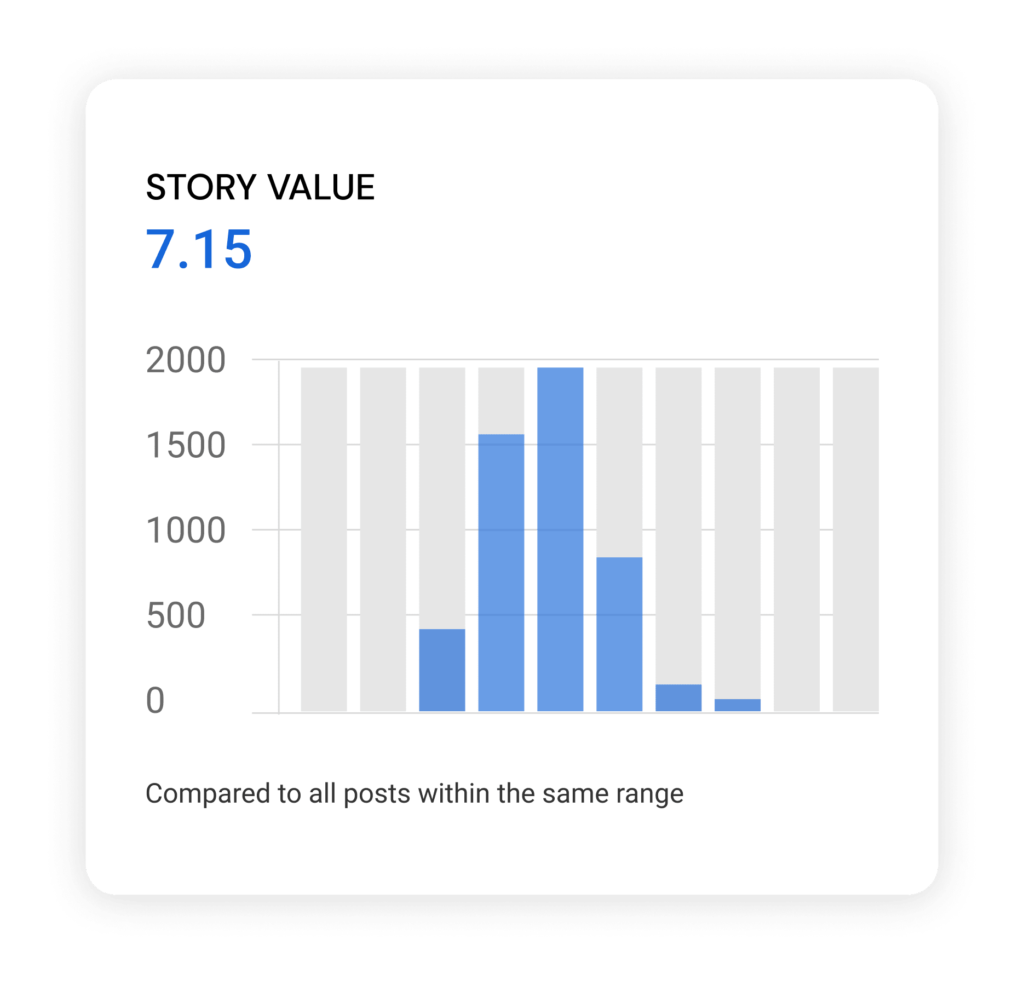
A chart showing the "Story Value" of 7.15 compared to all posts within the same range. The histogram visualizes the distribution of posts, illustrating media monitoring and analysis metrics for evaluating the impact of stories across platforms.
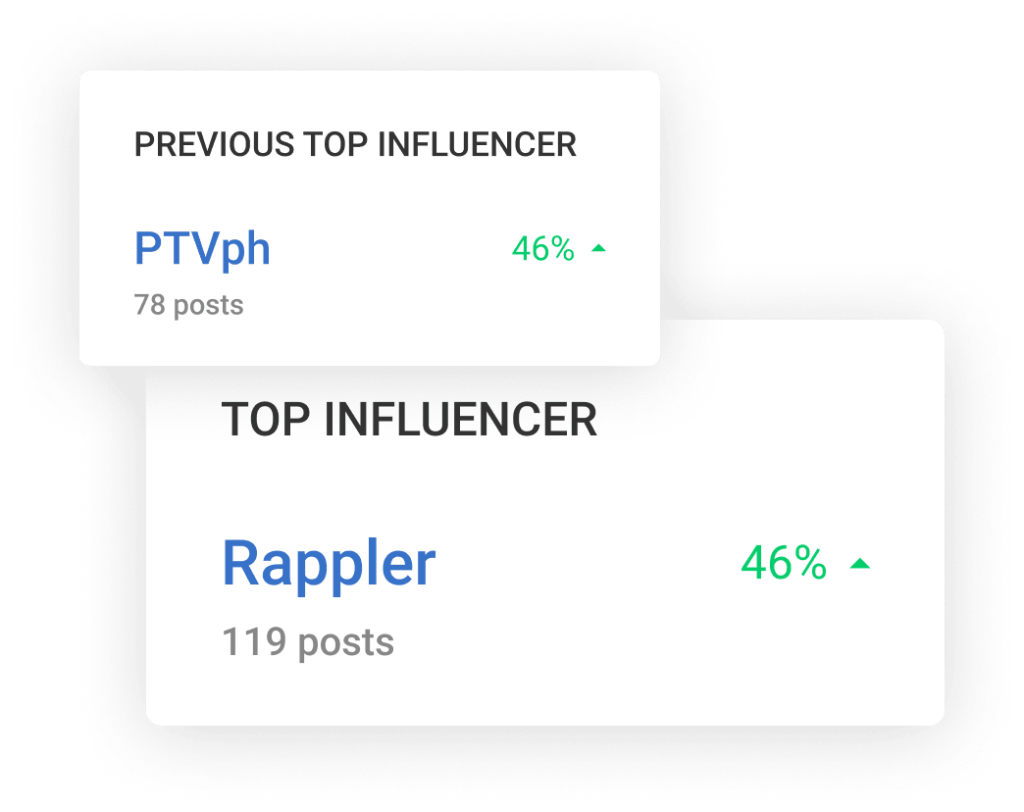
A media monitoring dashboard highlighting top influencers. The "Previous Top Influencer" is listed as PTVph with 78 posts and a 46% increase. The current "Top Influencer" is Rappler with 119 posts and the same 46% increase. This dashboard tracks the performance and influence of media outlets or individuals, relevant for analyzing media coverage and managing brand reputation.

Top Influencers

Quickly identify and rank the Top Influencers who are talking about your brand the most.

The list of Top Influencers generated by our social listening tool is based on the Story Value of each post, as well as the publisher’s level of activity, reputation, and the number of people subscribed to the publisher.

Top Mentioned Entities

Determine and rank other entities that are often mentioned on social media alongside your brand.

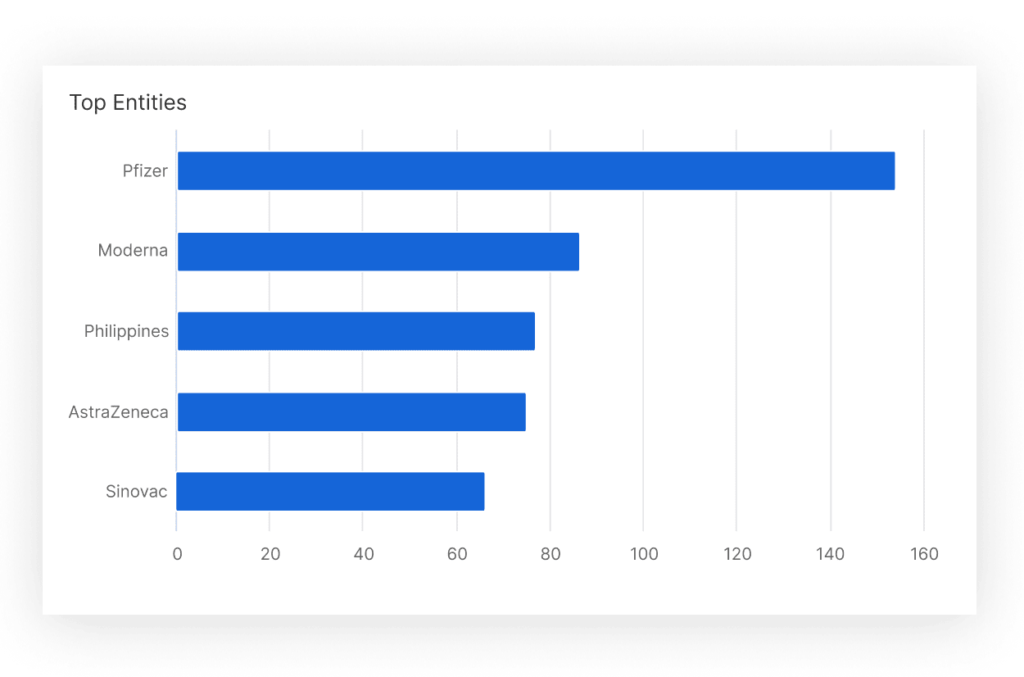
A bar chart titled "Top Entities," showing media coverage distribution among various entities. Pfizer leads with the highest coverage, followed by Moderna, the Philippines, AstraZeneca, and Sinovac. This chart provides insights into media mentions, relevant for tracking brand reputation and comparing the media presence of different organizations or topics.
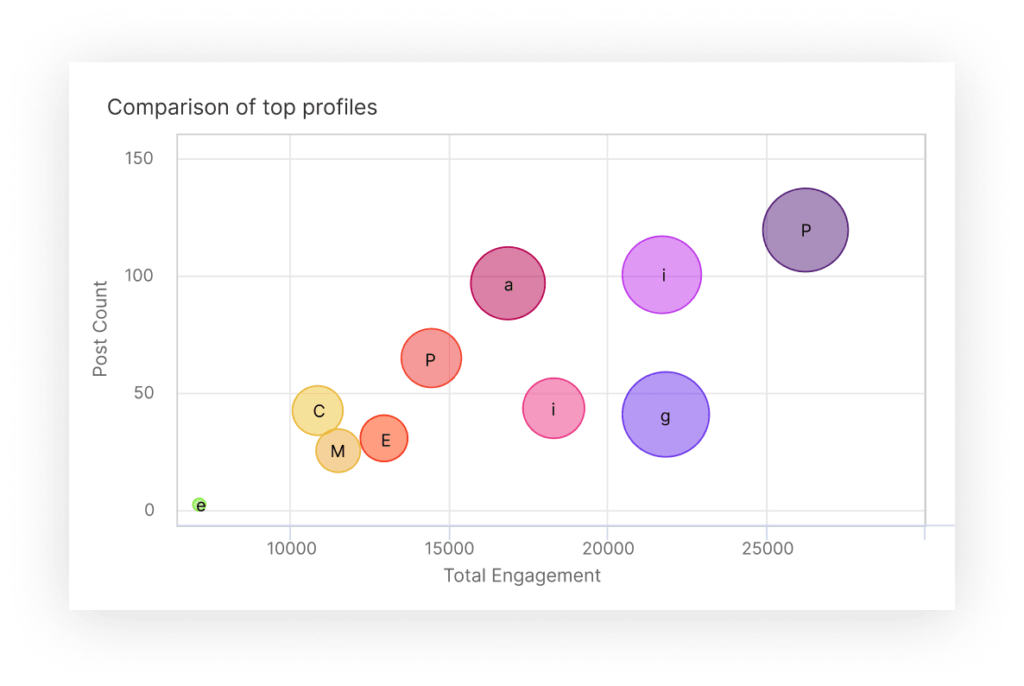
A bubble chart titled "Comparison of top profiles," showing the relationship between post count and total engagement across various profiles. Each bubble represents a profile, with the size of the bubble indicating the level of engagement. The chart visually compares the performance of different profiles, helping to identify the most influential ones in terms of both post count and engagement. This chart is relevant for analyzing social media influencers, tracking PR campaign success, and managing brand reputation through influencer marketing.

Most Engaging Posts

Identify the most relevant posts with the most engagement across all social media platforms and see what the online conversations are like.

What our social media monitoring reports include

Performance Drivers

Displays the authors, publishers, or topics that may drive up engagement for mentions of your brand.

Media Performance Overview

Summarizes how much media coverage and engagement your brand received for the week, month, or quarter.

Industry Landscape Analysis

Provides an overview of the most talked about stories in your industry.

Key Topics for the Month

Displays the topics and media conversations that were most relevant to your brand.

News Highlights for the Month

Includes a summary of the top stories about you based on Story Value, relevancy, and engagement.

Competitor Analysis Tool

Benchmarks the media coverage of your competitors against yours.

Better with Media Meter​

We’ll gather stories about you from thousands of sources and save you the hassle of sifting through all that noise, so you can focus on making the best possible decisions for your marketing and PR campaigns.

The Brand
Mention Dashboard

View all the stories that mentioned your brand. View videos, radio broadcasts, and print content that mentioned your brand directly from the dashboard.

The Media
Analytics Dashboard

Generate broadcast media reports, gaining further insights on your brand’s coverage with information such as total article count, top exposure medium, top author, and many more.

Competitor Analysis
and Industry News

Keep tabs on your competitors and stay on top of industry news so you’ll never miss an opportunity to join the conversation.

Discover key features​

Everything is contextual

Metrics are computed relative to the brand or topics you are comparing, allowing for better benchmarking.

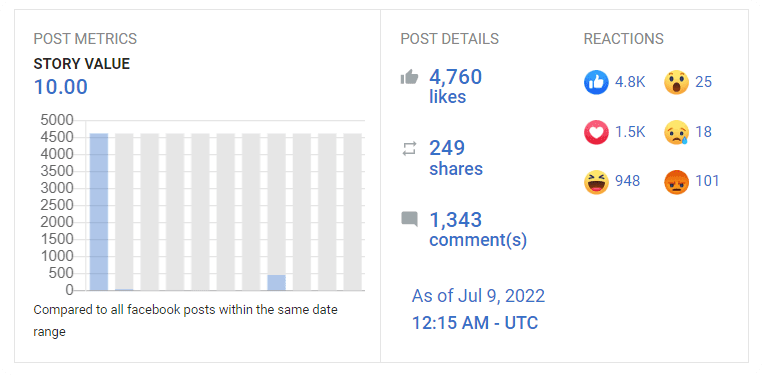
A media monitoring dashboard showcasing post metrics, post details, and reactions for a specific Facebook post. The "Story Value" is rated at 10.00, with a bar chart comparing it to other Facebook posts within the same date range. Post details include 4,760 likes, 249 shares, and 1,343 comments. Reactions are broken down into specific counts: 4.8K likes, 1.5K loves, 948 laughs, 25 wows, 18 sad faces, and 101 angry faces. The post's data is timestamped as of July 9, 2022, 12:15 AM UTC. This dashboard is used for analyzing social media engagement and tracking the performance of online content.

Everything can be compared

Contextualize your media analysis by comparing stories across multiple companies, industries, or issues.

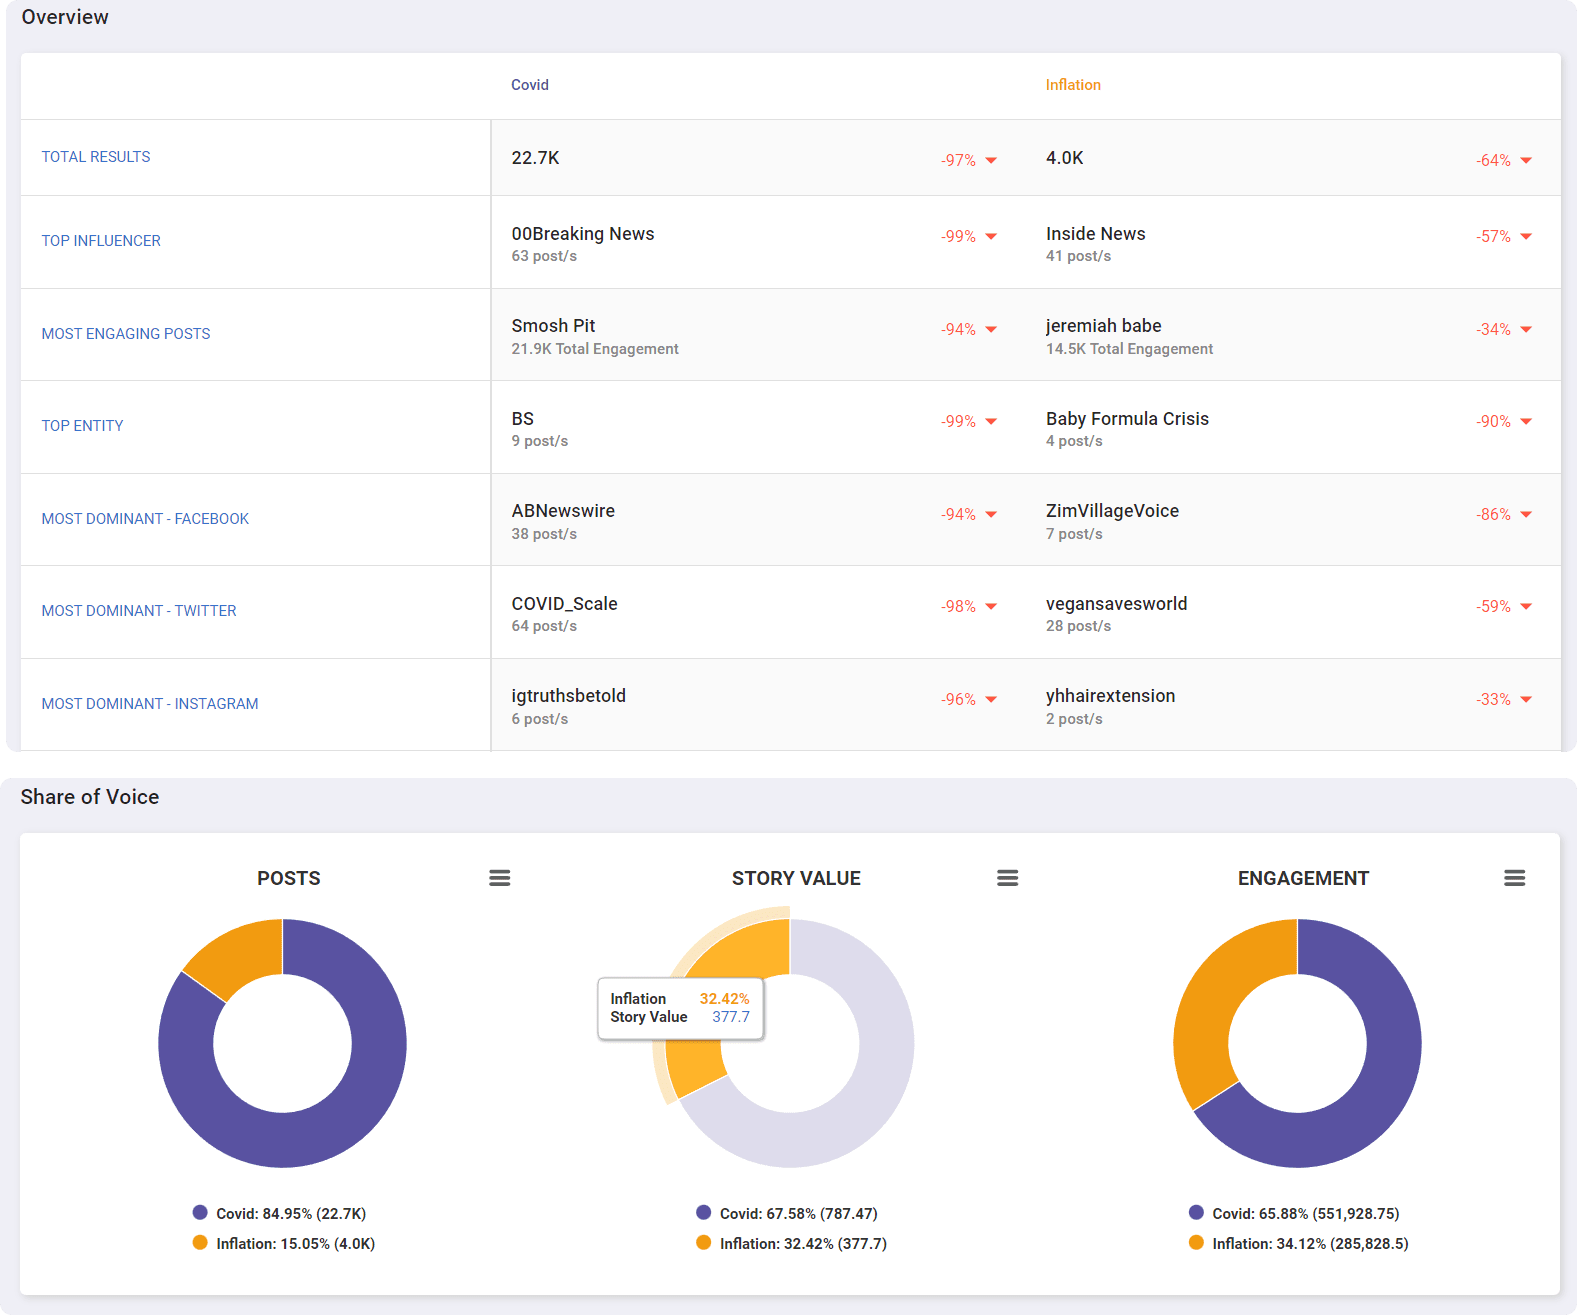
A media monitoring dashboard comparing coverage of "Covid" and "Inflation" topics. The overview section provides metrics such as total results, top influencers, most engaging posts, top entities, and most dominant social media platforms (Facebook, Twitter, Instagram). Covid has 22.7K total results, while Inflation has 4.0K. The share of voice section presents three pie charts comparing posts, story value, and engagement between the two topics. Covid dominates with 84.95% of posts, 67.58% of story value, and 65.88% of engagement, while Inflation accounts for 15.05%, 32.42%, and 34.12% respectively. This dashboard highlights media presence and engagement for the two topics, relevant for PR strategy and brand reputation management.

Global filters give you a closer look

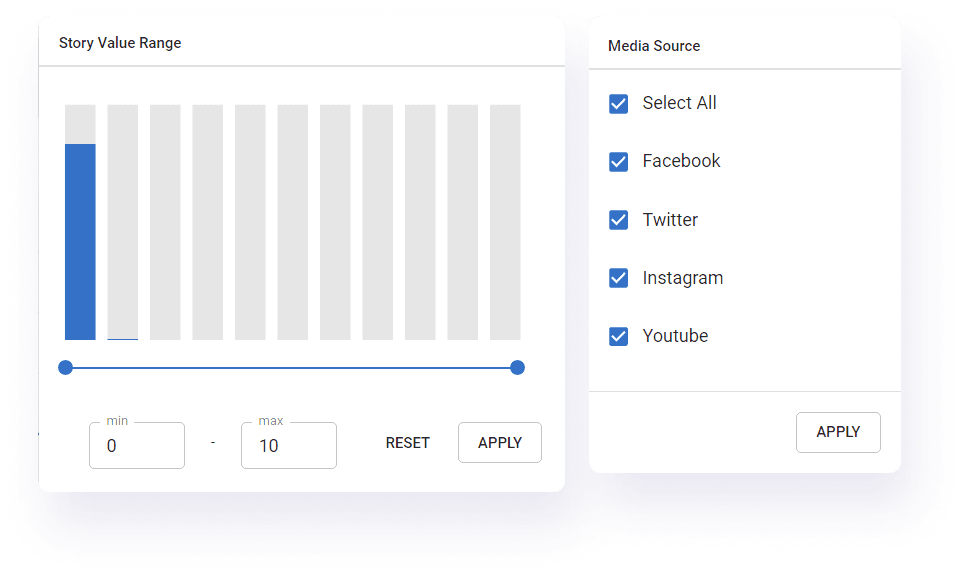
Refine your findings to fit your analysis—separate rich media from noise quickly and painlessly with our powerful global filters: including in-text search, date, media source, and filters based on our advanced ranking metrics.

A media monitoring tool interface with a "Story Value Range" filter on the left, showing a bar chart with sliders to adjust the minimum and maximum values. On the right, a "Media Source" filter allows users to select or deselect platforms such as Facebook, Twitter, Instagram, and YouTube. The interface is designed to refine media analysis by filtering story values and focusing on specific social media sources, relevant for managing brand reputation and tracking PR campaign performance across different platforms.

Drill down shows you what you want

Get more insights from your data. If you find any data point particularly interesting, simply click on it to drill deeper into the data.

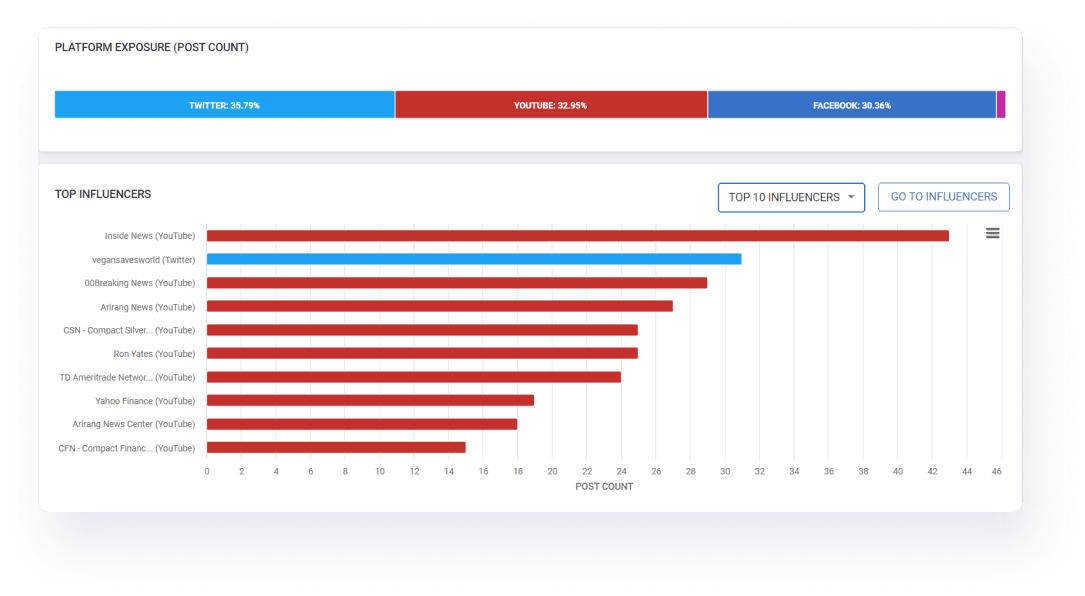
A media monitoring dashboard showcasing "Platform Exposure (Post Count)" and "Top Influencers." The top bar chart displays platform exposure with Twitter at 35.79%, YouTube at 32.95%, and Facebook at 30.36%. Below, the "Top Influencers" bar chart lists influential accounts such as Inside News (YouTube), vegansavesworld (Twitter), and 00Breaking News (YouTube), sorted by post count. This dashboard is used to analyze the reach and influence of media platforms and top contributors, relevant for managing brand reputation and tracking PR campaign performance across social media platforms.

It's easy to get started

Monitor and analyze the world's media.